
Now, we need to delve into the concept of volatility in order for you to grasp the essential aspects of trading and investing in options effectively. Let's dive straight into these key concepts.
Implied volatility (IV) represents the market's anticipation of a stock's future movement, while historical volatility (HV) reflects how the stock has actually performed in the past.
Before entering an options trade, it is crucial to assess the current relationship between IV and HV. This is akin to how a technical analyst studies stock charts to predict a stock's future behavior based on its past performance. Similarly, for options, HV can serve as a reliable indicator of where IV might be headed. Therefore, it is vital to identify any disparities between the two.
Discrepancies between historical volatility and implied volatility are not uncommon in the options market.
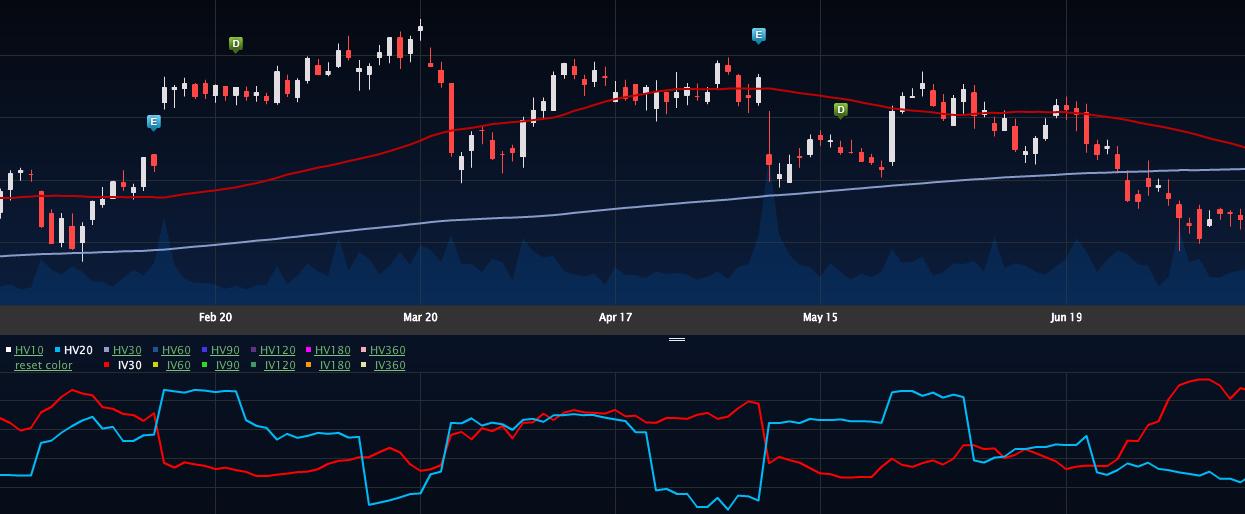
In the lower section of the chart depicted above, the interchanging lines represent implied and historical volatility. The light blue line corresponds to historical volatility (HV), while the red line represents implied volatility (IV).
What causes these variances?
Consider a scenario where a company is approaching an earnings announcement. As the event nears, the heightened uncertainty prompts speculators and hedgers to participate in the market, driving up options prices. Subsequently, once the announcement is made, the implied volatility decreases significantly due to the disappearance of that uncertainty.
For instance, following H&R Block's quarterly earnings release on June 13, 2017, there was a notable decline in implied volatility the next day.
It is essential to consider the implied volatility levels before an options position to determine whether it is relatively expensive or.
When a significant exists between implied volatility and historical volatility, it is prudent to investigate if there is an event, either upcoming or recently occurred, that could explain this disparity If no such event can account for the difference, it is typically advisable to purchase options when historical volatility exceeds implied volatility and sell options when the reverse is true.
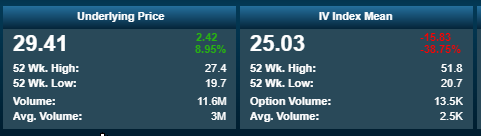
Another method to assess option pricing is by comparing implied volatility levels over a period. For instance, using the example of H&R Block with implied volatility ranging from 20.7% to 51.8%, purchasing options with a 25% implied volatility would be considered relatively inexpensive.
Factors causing option volatility to increase include uncertainty, fear, and greed. Notably, implied volatility tends to surge more rapidly during stock declines as the demand for put protection escalates, increasing the cost of hedging.
Events that spark uncertainty encompass market sell-offs, FDA announcements, earnings reports, legal actions against a company, regulatory developments, analyst days, and rumors of takeovers. Essentially, any event that casts doubt on a stock's future performance can elevate implied volatility. Once this uncertainty resolves and the market digests the information, implied volatility is likely to decrease.
Moving forward, we will delve into the option sensitivities, commonly known as the Greeks, and explore how various factors influence an option's value.